
This is a follow-up to my previous post about building an autonomous AI agent squad. I've been through a few iterations of dashboards and monitoring setups. Here's what I learned, what I'm using now, and why it might be different for you too.
The Dashboard Problem
The problem is, I stopped being the person who watches everything. My agents do that now.
When you have autonomous agents running your scrapers, posting to X, monitoring market trends, handling customer support, and drafting reports, you don't need a control room. You need a glance-and-go interface that tells you three things:
- Is everything running?
- What's being built right now?
- Does anything need me?
Everything else is noise. And I learned that the hard way after building and abandoning three dashboard prototypes before landing on the one I use today.
The Evolution: From Pixel Art to Infrastructure
If you read my last post about the pixel-art Mission Control dashboard, you saw the first version. Character sprites at workstations. Server racks with blinking lights. A pixel world where every agent had a face and a desk.
It was awesome. Genuinely fun to look at. And completely wrong for what I needed.
The pixel art looked great but it was a view into a world, not a view into my business. I was spending more time looking at cute characters than understanding what was actually happening. The dashboard was art, not operations.
So I stripped it down. Removed the characters. Removed the server rack animations. Removed everything that didn't answer one of those three questions. What I ended up with is boring by design. And that's exactly why it works.
The Core Idea: Your Dashboard, Your Infrastructure
The most important thing I learned: your dashboard should reflect your infrastructure, not some generic template.
I tried pre-built dashboards and they all assumed I wanted to see CPU graphs, memory usage, and request latency. Those are useful metrics when you're running a web service. But I'm not running a web service. I'm running an agent system with scrapers, pipelines, and automated workflows.
My dashboard has four sections, and each one maps directly to something happening in my actual infrastructure:
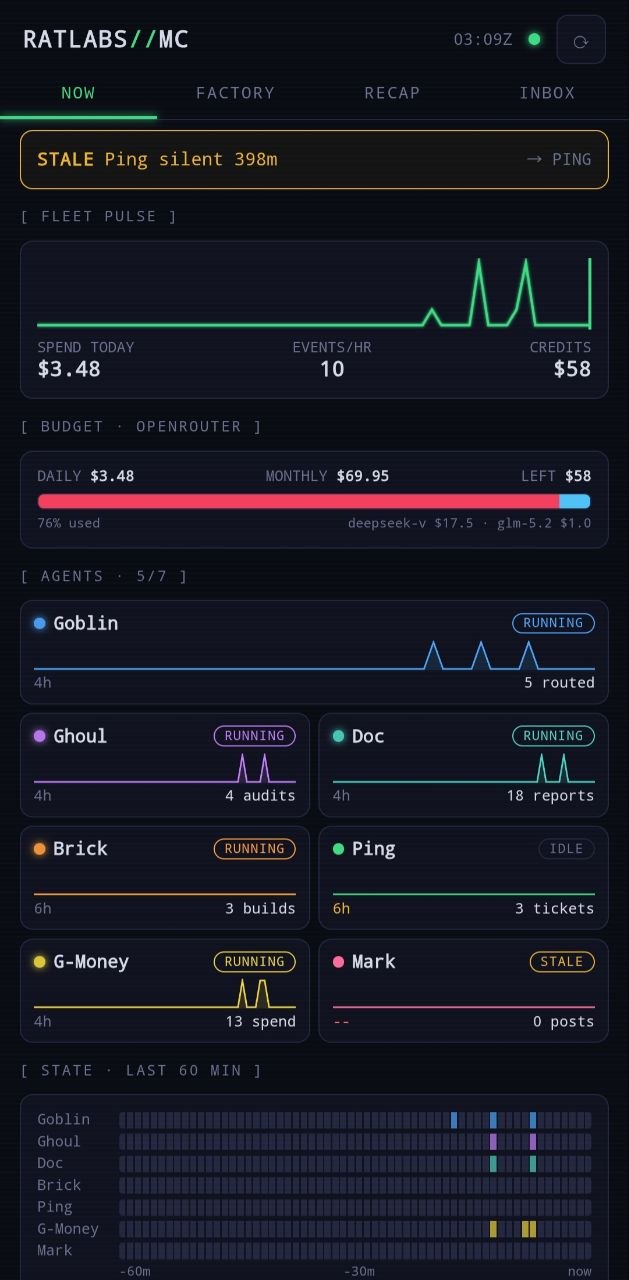
NOW: The Activity Feed
What it shows: A scrolling list of recent events from every agent. A scraper finished. A post went out on X. A customer support draft was written. A research scan completed.
Why it exists: I don't want to check individual agent logs. I want to glance at my phone and know the machine is humming. If the ticker stops, I investigate. If it's scrolling, I'm done.
What gets posted here: Every agent drops a one-liner when it completes a task. Doc finishes a trend scan, it shows up. Brick deploys an update, it shows up. Mark posts to X, it shows up. The feed is the pulse of the system.
FACTORY: Active Workstreams
What it shows: What's being built right now. Scrapers updating, deployments running, content being drafted. A kanban-style view of current work.
Why it exists: A factory floor doesn't just show you which machines are running. It shows you what they're making. The FACTORY tab tells me what my agents are producing, not just that they're busy.
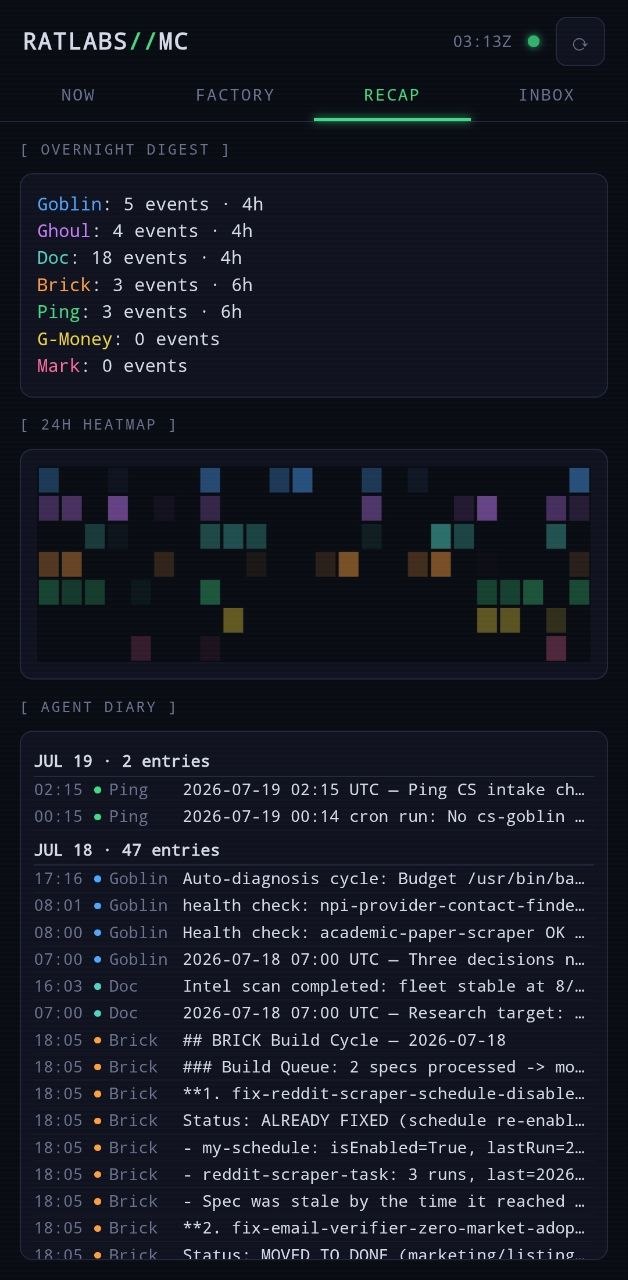
RECAP: What Happened Since I Last Checked
What it shows: A digest of completed work, decisions made, and items needing attention. Generated by the agents themselves, summarizing their own work.
Why it exists: Time-shifted awareness is more important than real-time awareness. I don't need to know the moment a scraper finishes. I need to know, at the end of the day, whether all scrapers finished and what changed.
INBOX: What Needs a Human
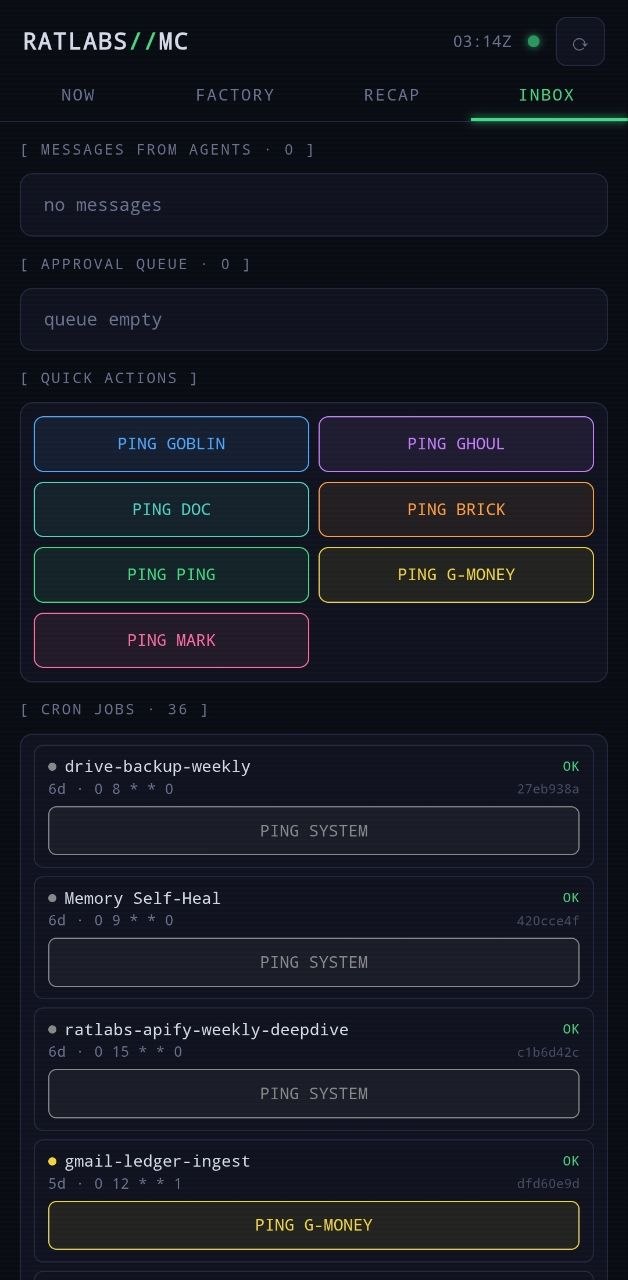
What it shows: Items agents can't decide on their own. An architecture proposal. A content approval. A pricing decision.
Why it exists: This is the most important section. The goal is to keep it at zero. Every item here is a gap in the agents' autonomy. Over time, as I approve or reject proposals, the agents learn and the INBOX shrinks.
What the Agents Actually Do (So You Don't Have To)
The dashboard is the window. The agents are the workers. Here's what they handle every day without me touching anything:
Doc scans the web for market trends, competitor moves, and emerging demand signals. Every result is embedded into a vector database. When another agent needs research context, it queries that vector store semantically. Old data, new data, patterns across time. Doc keeps the knowledge base fresh.
Mark monitors the marketing pipeline. When a new feature ships or a scraper updates, Mark drafts an X post, schedules it, and posts it. The post copy is informed by Doc's research trends and the vector store's semantic search. No manual tweeting, no forgetting to post.
Brick handles infrastructure changes. Scraper updates, dependency bumps, deployment patches. If a scraper's target API changes, Brick detects it, patches the code, and deploys the fix. Autonomously. Logs the result.
Ghoul audits everything. Reviews Brick's deployment logs against expected state. If something drifted, Ghoul raises a ticket. If everything matches, files a clean audit report. No human review needed for routine work.
Ping handles customer support. Scans incoming emails, classifies them (bug, question, feature request), searches past interactions in the vector store, and drafts a reply. Never auto-sends. Always wraps in [SUPPORT DRAFT - review before sending].
G-Money runs end-of-day metrics. Compiles reports, checks budgets, writes summaries to a monthly report sheet. The numbers flow into the dashboard without me touching a spreadsheet.
All of them talk to each other. Doc's research feeds Mark's posts. Brick's builds get audited by Ghoul. Ping's support interactions get learned into the knowledge base. The loop is automatic.
The Cron Loop That Makes It Work
Here's the actual schedule that runs this whole thing without me:
0 6 * * *   Doc research brief to shared workspace
15 6 * * *  Goblin review brief to priority decisions
30 6 * * *  Mark draft social posts to INBOX
45 6 * * *  Brick execute updates to deployment log
0 7 * * *   Ghoul audit logs to audit report
0 20 * * *  G-Money daily metrics to report sheet
Each cron job is a self-contained agent session. It loads the right skill, reads the output of the previous job, and produces its own output. The chain is automatic. As long as each job finds the data it expects, the loop runs.
Beyond the Dashboard: When Something Actually Matters
The dashboard is pull. I check it when I want. But agents also push when something matters:
Email notifications for new INBOX items. The subject tells me the category. I can triage from my phone.
Calendar reminders when an agent proposes a change with a deadline. The agent creates the event. I don't have to remember.
Monthly reports to Google Drive. Compiled by G-Money, pushed to a shared folder. Historical, searchable, accessible from anywhere.
The threshold for push is high. Most things just scroll by on the dashboard. The agents only escalate when they genuinely can't decide.
What I Got Back
The honest answer: about 15 to 20 hours per week.
Before this setup, I was checking agent logs multiple times a day, manually connecting research to builds, writing status reports, and wondering if something was broken until someone told me.
Now I open the dashboard twice a day. Process the INBOX in under 10 minutes. The rest runs itself.
The time I've reclaimed goes into other projects. Small experiments, new tools, the kind of work that gets buried when you're managing rather than building.
What's Next
Version 1.0 is running and paying for itself. But I'm already thinking about what's next.
- Live SSE streaming for real-time updates without polling
- A proper agent diary for searchable, cross-referenced history of every decision
- More autonomous loop closures so fewer items make it to the INBOX
The goal is the same as it was on day one: build a business that runs itself, then go work on the interesting stuff.
If you're building agent systems, what does your dashboard look like? I'd love to hear what's working for others. Drop me a reply or find me on X @shiftmick.
Resources
Tools Used:
- Hermes Agent by Nous Research - The agent framework that powers everything
- FastAPI - Python web framework for the dashboard backend
- Tailscale - Private network for secure dashboard access
- Google Workspace - Drive, Docs, Calendar, Email
- Apify - Cloud platform for scraping and automation
- Qdrant - Vector database for semantic search across agent knowledge
Related Posts:
- Mission Control: The Visual Dashboard That Changed How I Work With AI Agents
- Building RatLabs OS: An Autonomous Agent Architecture That Runs From Your Phone
- Goblin & Ghoul: Building an Autonomous Agent Army on $3/Day
- Six Months Into Agent Orchestration: What I've Learned
- Building an Autonomous Apify Actor Factory with AI Subagents